Note: For a fit involving few experimental points, an outlier can greatly widen the Prediction Band and go undetected, especially if the residuals do not approximate a normal distribution (even minimally). See the fictitious example with few data points and leverage effect (Y = A * X + B): (1, 2); (2, 4); (3, 5); (4, 7); (5, 9); (6, 45). Visually, point (6, 45)
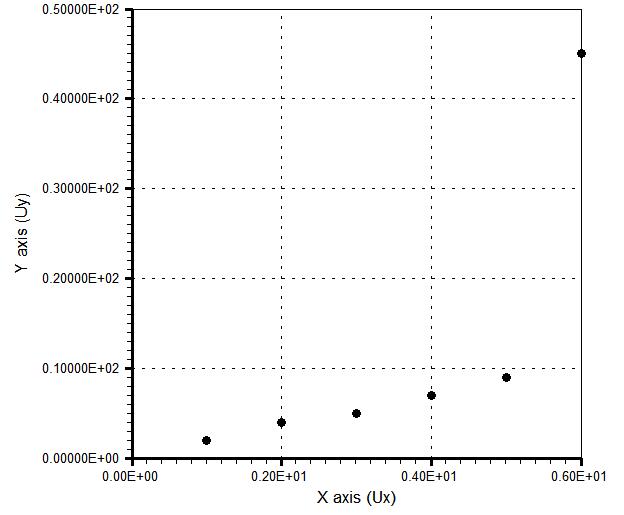 can be rejected (but it is a masked outlier in the fitting of Y = A * X + B)! The fit of the function to the other 5 points, with extrapolation to X=6,
shows a
"Prediction Band"
can be rejected (but it is a masked outlier in the fitting of Y = A * X + B)! The fit of the function to the other 5 points, with extrapolation to X=6,
shows a
"Prediction Band"
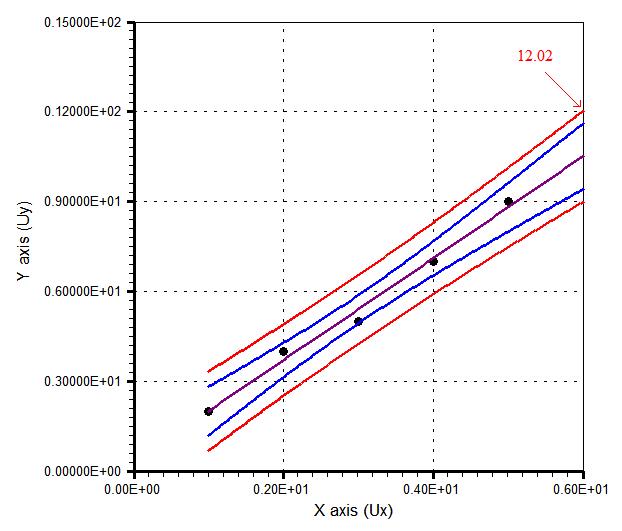 that corroborates the visual removal.
Details button: displays a complete report of all results obtained during the curve fitting process, including intermediate results.
Evaluate button: displays the results of Y(X) for user-specified X values, including average values and their uncertainties (95.4% confidence level).
Residuals button: displays the scatter plot of residuals, including the result of the Durbin-Watson test.
OK button: Displays the graph of the fitted function (2D and 3D cases) or returns to the software's main menu.
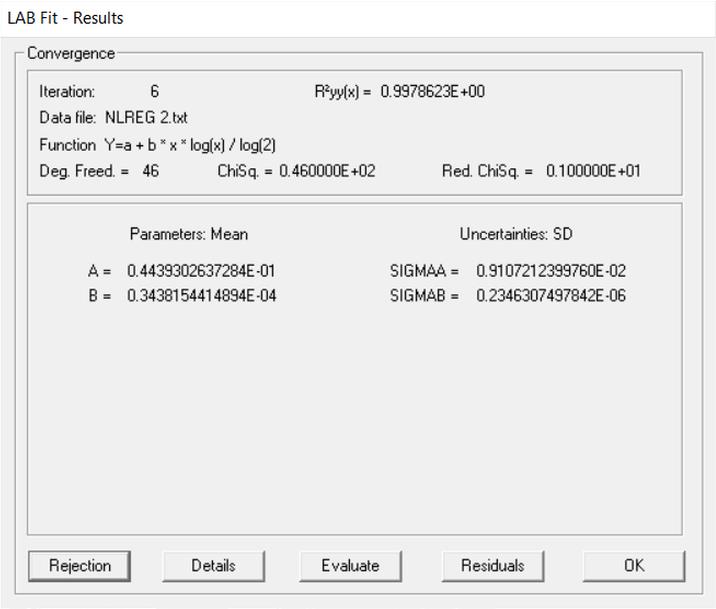
Attention: When the "OK" button is clicked, closing the "LAB Fit - Results" dialog box, various pieces of information regarding the completed fit become available by clicking one of the buttons labeled "R Fin", "R Fit", "R Gr" or "Files".